Bar Graph Report Diet Adequacy Report
- Nate Edwards
- Alicia Triplett
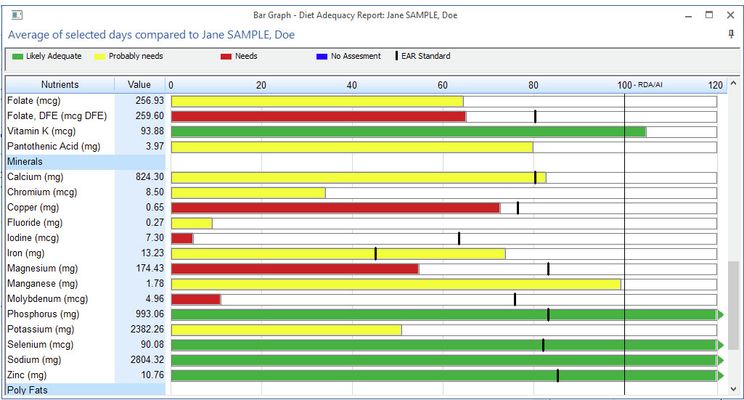
The Bar Graph Report displays graphically the amount of the nutrient consumed and compares that to the dietary intake recommendations. If desired, the Bar Graph Report can display color-coded Diet Adequacy based on recommendations (RDAs: Recommended Dietary Allowances or AIs: Average Intakes). In addition, the EARs (Estimated Average Requirements – the intake level for a nutrient at which the needs of 50 percent of the population will be met) will be shown if Diet Adequacy is selected.
To see Diet Adequacy and EARs, check Show Diet Adequacy on the Report ribbon. The bar colors will change to graphically display the assessment of the adequacy of the diet for the Person you have open.
- Green - The intake of this nutrient is likely adequate (determined by => RDA or => AI).
- Yellow - The intake of this nutrient is low and probably needs to be evaluated and possibly increased (determined by >EAR and <RDA).
- Red - This intake of this nutrient needs to be evaluated and likely increased (determined by <EAR).
- Blue - No assessment is possible for nutrient levels that are below an AI standard, or for Calories, or carbohydrate, since the goal for these nutrients could either be above or below their calculated standards (determined by <AI).
In order to see the Bar Graph report for a Recipe, you must first specify a profile to compare with the Recipe. If a profile has not been specified, you are prompted to do so when the Bar Graph report is selected.
Not all nutrients that are offered in the software have a DRI standard. Bars are shown only for those nutrients that have recommended values in the profile being compared to. If there is no nutrition goal for a nutrient, there is a blank % and no graphic bar.
If you choose to analyze for all days, the percentages shown are for an average of all days
If you have selected to analyze for one day only, click on that day in the Diet Recall to see its corresponding analysis.