Genesis R&D Manual
Bar Graph
- Nate Edwards
Owned by Nate Edwards
Jun 28, 2017
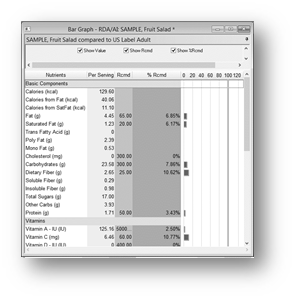
The Bar Graph Report information is similar to that in the Multi-Column report – amount and percent recommendation met – represented graphically.
In order to see the Bar Graph report for a Recipe, you must first specify a profile to compare with the Recipe. If a profile has not been specified, you are prompted to do so when the Bar Graph report is selected.
Bars are shown only for those nutrients that have recommended values in the profile being compared to. If there is no nutrition goal for an item, there is a blank % and no graphic bar.
, multiple selections available,