Genesis R&D Manual
Calories and Fats (Pie Chart and Bar Graph)
- Nate Edwards
Owned by Nate Edwards
Jun 28, 2017
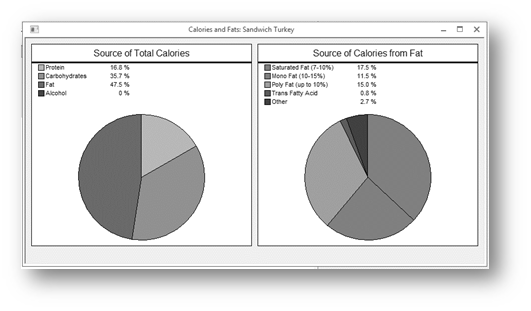
The Calories and Fats reports are useful for quickly seeing the calorie and fat breakdowns of your Recipe.
The Source of Calories window shows graphically the percentage of calories from protein, carbohydrates, fat, and alcohol.
The Source of Fat window shows the breakdown of fat (saturated, monounsaturated, polyunsaturated, and other fats).
The display of the Source of Calories can be represented as either a pie chart or as a bar graph.
, multiple selections available,