Nutrient Sidebar -Recipe
- Nate Edwards
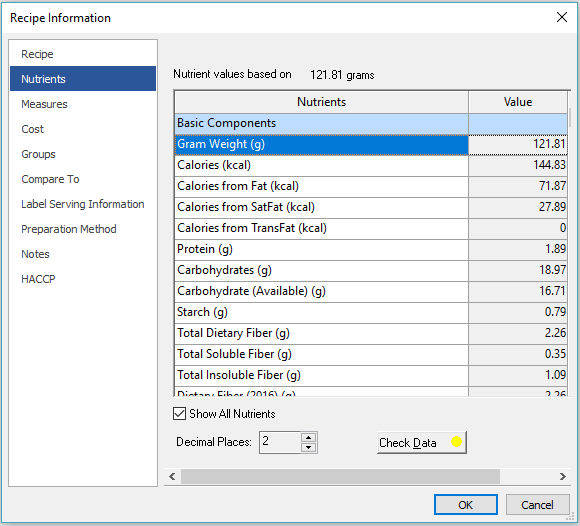
This screen shows the Nutrient content of the Recipe. Nutrient content is calculated from the items included in the Recipe.
If desired, values may be overridden. The Override values will appear on the label and in reports.
Nutrient Values
- Check the Show Analysis Override box. (Check Show All Nutrients to override ALL the nutrients available, not just the ones selected in Nutrients to View.)
- Type the new value in the Override column. The program will automatically convert it to units of the corresponding measurement and display both the Override values and %DV when applicable.
Decimal Places
Select how precise you want the values to appear by choosing the number of Decimal Places. This will only affect the nutrient display here, not on the Reports.
Check Data
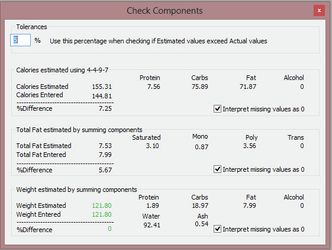
The Check Data feature lets you quickly verify if the information as entered by you and calculated by the program (Actual values) is within the range of what the values should be as estimated by totaling the values for the individual components (Estimated values).
For example:
In a Recipe, the total number of Calories per serving as entered is 157.5. The values for each component that makes up the total number are:
- 1.9 g protein
- 19.9 g carbohydrates
- 9 g fat
So, each component multiplied by its appropriate 4-4-9 number gives us the following as shown:
- 7.8 protein calories
- 79.6 carbohydrate calories
- 81 fat calories
For a total of 168.4 calories (as compared to 157.5)
The difference between the two is 6.8%. We set our tolerance level at 10%. This comes in well under that level, so the data check gets the green light.
If we set the tolerance at 5% the check data button would have been yellow indicating that the levels weren’t exact, but nothing to worry about. Keep in mind that there are levels of error even for lab testing so 5% is likely too low of a level. We recommend a 10% tolerance level.
If the Check Data button is red, there is at least one check that is outside the set percent tolerance. Red values should be checked by the user. If the numbers turn out to be correct, the percent tolerance can be adjusted until the results are listed in green (within tolerance).
Interpret missing values as 0.
This feature also lets you know if there are missing values by treating missing values as 0, thereby tripping the Check Data warnings. To turn this off, uncheck the box.